
After the development of Prometheus, more than 100 businesses have adapted it, and it has a very active community, and become an independent open-source project. Making Prometheus’ structure more mature, it has joined the Kubernetes and Cloud Native Computing Foundation in 2016.
Main Features
Prometheus gains attractions of many businesses due to the following features:
- It is a multi-dimensional full cycle development data model which stores all data as time series streams
- It offers a functional expression language PromQL which permits a user to select and aggregate time series data in real time, and results will be shown in graphs
- It doesn’t rely on distributed storage, no reliance on distributed storage; single server nodes work independently
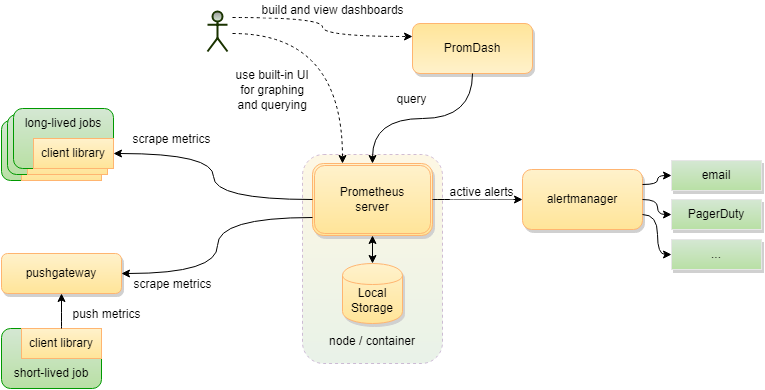
- The data is collected using time series over HTTP via pull model
- The intermediary gateway allows pushing time series for monitoring components
- It discovers targets using static configuration or service discovery, and
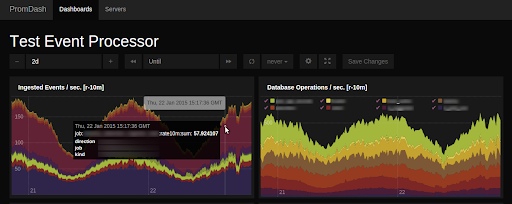
- Also supports a number of graphics modes dashboards support
Basic Concept of Prometheus
Prometheus basically stores all data in the form of time series streams. Along with the stored time series, Prometheus also creates a temporary time series which derived as the result of the queries. For data models, Prometheus normally doesn’t use a dotted string such as healthcraft.running.distance. It uses multidimensional labels such as healthcraft{exercise=”running”, measure=”distance”}.
There are four metric types used by Prometheus client libraries, and these are differentiated for the usage of the specific type of APIs in the wire protocol.
- Counter: A cumulative metric whose value can only be increased or reset to zero when it is restarted.
- Gauge: Is a metric that characterizes a single numerical value which can be randomly gone up and down and are normally used to measure values like temperature, memory usage.
- Histogram: Are samples observations which are counted in configurable buckets and provide a sum of all observed values.
- Summary: Provides a sum of all observed values while calculating configurable quantiles over a sliding time window.
Prometheus has achieved remarkable reliability and agility where each Prometheus server is working as a standalone without depending on network storage, remote services, and setting up extensive infrastructure.
How to Install Prometheus?
As the time of writing, Prometheus v2.6 is the latest version. To install Prometheus, Download the latest release of Prometheus and extract it to run.
tar xvfz prometheus-*.tar.gz

cd prometheus-*
For monitoring itself, Prometheus collects the metric data from the targets by scraping metrics HTTP endpoints. For step-by-step configuration, please refer to the configuration documentation.
For starting Prometheus from a configuration file, directory/path will be changed which contains binary.
# Start Prometheus.

# By default, Prometheus stores its database in ./data (flag --storage.tsdb.path).

./prometheus --config.file=prometheus.yml
Storage for Prometheus
Prometheus uses a local on-disk time series database in a custom format on local disk, and can also be integrated with remote storage systems.
Time series data is stored on local disk in the form of ingested samples which are further grouped into two-hour blocks where every two hours’ block comprising a directory of chunk files that contain all-time series samples. All these sample blocks are kept in memory and are secured against crashes by using a write-ahead-log (WAL), and will be replayed in case of Prometheus server crashed.
Prometheus Comparison with Other Relevant Monitoring Tools
Prometheus can be measured with other same solutions available in the market on the basis of the following parameters. Following table shows the comparison between Prometheus and other available monitoring solutions in the market.
| Features | Prometheus | Graphite | InfluxDB | OpenTSDB | Nagios |
| Scope | Full monitoring, built-in scraping, querying, graphing | Passive time series, query language, graphs | Time series, continuous queries, | Distributed time series, query language, graphs | Alerting-based, codes of scripts (checks) |
| Data Model | Stores numeric samples, | Stores numeric samples, | Key-value pairs (tags), | arbitrary key-value pairs | Host-based, no query language |
| Storage | Time series on local disk at arbitrary intervals | Time series on local disk | Log-structured merge tree with write head log | implemented on top of Hadoop and HBase, | No storage, plugins store data |
| Summary | Richer data model, query language, easy integration | Clustered solution, hold historical data long term | Event logging, clustered solution | Long term storage on Hadoop | Basic monitoring of static systems |
Prometheus Use Cases
Businesses are taking benefits of the open source customizable, simple, and cost-saving monitoring system. Prometheus offers a key factor for a modern and up-to-date DevOps workflow, cloud-native and mobile apps, and monitoring of custom software development, and hybrid development models.
Following are some use cases of implementation of Prometheus monitoring:
Behemoth Northern Trust: A Financial Service
Financial services Behemoth Northern Trust turned to Prometheus in June 2017 for application monitoring and a better view of some of its hardware.
Datawire
Datawire is an open-source custom software development company who develop micro-services on Kubernetes. They run several mission-critical cloud services in Kubernetes via AWS to support our open source efforts. They use Prometheus to monitor their mission critical microservices in Kubernetes. For monitoring purposes, Datawire wanted that their engineers should have flexibility and control over their metrics infrastructure.
Presslabs
Presslabs is a web-hosting solution which offers high-performance managed WordPress hosting architecture for enterprises, publishers and bloggers, and digital businesses to provide a seamless website visiting experience. During 2017, Presslabs platform has started a large-scale transition where they migrated to Kubernetes platform which requires high-performance monitoring system. Then, Presslabs decided to make their minds to use Prometheus and integrate it across all their services on the new platform as a central piece for extracting and exposing metrics.
Bottom line
After Kubernetes, Prometheus became a one and only open-source project and joined the CNCF as the second hosted project in 2016. These systems and service monitoring system collects metrics from configured targets at given intervals, evaluates rule expressions, displays the results, and can trigger alerts if some condition is observed to be true. It is licensed under the Apache 2.